Updated: 2025-04-13 06:27 CEST
Locality
| Locality: |
Teplice
|
|
| Code: |
UTPMA |
| Type of measuring programme: |
Automated measuring program |
| Locality owner: |
Czech Hydrometeorological Institute |
| Abbreviation: |
B/S/R |
| Coordinates: |
50° 38´ 43.004" North latitude 13° 51´ 4.499" East longitude |
| Altitude: |
257 m |
Actual measured level of air pollution
Actual unverified data
| 2025-04-12 06:00 - 07:00 CEST |
14.4 |
|
|
| 35.1 |
61.5 |
54.1 |
20.7 |
12.7 |
| 2025-04-12 07:00 - 08:00 CEST |
13.0 |
|
|
| 35.1 |
55.6 |
38.9 |
22.1 |
29.7 |
| 2025-04-12 08:00 - 09:00 CEST |
17.0 |
|
|
| 41.1 |
50.0 |
37.0 |
22.9 |
29.7 |
| 2025-04-12 09:00 - 10:00 CEST |
19.4 |
7.0 |
|
| 65.0 |
51.8 |
37.0 |
22.9 |
25.6 |
| 2025-04-12 10:00 - 11:00 CEST |
12.5 |
7.3 |
|
| 97.0 |
55.2 |
26.4 |
23.0 |
26.6 |
| 2025-04-12 11:00 - 12:00 CEST |
6.7 |
7.4 |
|
| 87.4 |
58.1 |
26.4 |
23.2 |
26.6 |
| 2025-04-12 12:00 - 13:00 CEST |
4.0 |
7.5 |
|
| 96.8 |
63.4 |
24.7 |
24.2 |
10.2 |
| 2025-04-12 13:00 - 14:00 CEST |
3.7 |
7.5 |
|
| 98.8 |
69.5 |
17.9 |
24.4 |
10.2 |
| 2025-04-12 14:00 - 15:00 CEST |
3.5 |
7.4 |
|
| 103.9 |
78.1 |
17.9 |
24.3 |
10.6 |
| 2025-04-12 15:00 - 16:00 CEST |
3.5 |
7.5 |
|
| 106.1 |
87.0 |
11.2 |
23.9 |
5.9 |
| 2025-04-12 16:00 - 17:00 CEST |
3.5 |
7.5 |
|
| 103.7 |
94.8 |
7.8 |
23.7 |
5.9 |
| 2025-04-12 17:00 - 18:00 CEST |
3.2 |
7.6 |
|
| 105.9 |
99.9 |
7.8 |
23.5 |
4.2 |
| 2025-04-12 18:00 - 19:00 CEST |
3.7 |
7.7 |
|
| 107.5 |
101.3 |
20.2 |
24.0 |
1.0 |
| 2025-04-12 19:00 - 20:00 CEST |
3.7 |
7.7 |
|
| 109.3 |
104.0 |
20.2 |
24.0 |
1.0 |
| 2025-04-12 20:00 - 21:00 CEST |
3.2 |
7.7 |
|
| 99.9 |
104.4 |
19.3 |
24.0 |
9.8 |
| 2025-04-12 21:00 - 22:00 CEST |
5.6 |
7.8 |
|
| 81.4 |
102.2 |
26.9 |
24.4 |
5.5 |
| 2025-04-12 22:00 - 23:00 CEST |
5.1 |
7.8 |
|
| 88.4 |
100.3 |
26.9 |
24.8 |
5.5 |
| 2025-04-12 23:00 - 00:00 CEST |
4.8 |
7.7 |
|
| 85.0 |
97.6 |
9.6 |
24.2 |
12.3 |
| 2025-04-13 00:00 - 01:00 CEST |
5.3 |
7.8 |
|
| 79.4 |
94.6 |
9.6 |
23.9 |
7.4 |
| 2025-04-13 01:00 - 02:00 CEST |
5.6 |
7.8 |
|
|
| 93.0 |
15.8 |
23.8 |
7.4 |
| 2025-04-13 02:00 - 03:00 CEST |
5.1 |
7.6 |
|
| 66.6 |
87.1 |
25.2 |
24.1 |
10.6 |
| 2025-04-13 03:00 - 04:00 CEST |
| 7.5 |
|
| 66.4 |
81.0 |
25.2 |
24.2 |
10.6 |
| 2025-04-13 04:00 - 05:00 CEST |
5.9 |
7.5 |
|
| 64.4 |
75.9 |
13.0 |
23.9 |
26.8 |
| 2025-04-13 05:00 - 06:00 CEST |
5.3 |
6.9 |
|
| 57.1 |
72.5 |
17.9 |
22.4 |
18.7 |
|
|
Component is not measured |
|
|
Incomplete data |
|
|
Limit exceeded |
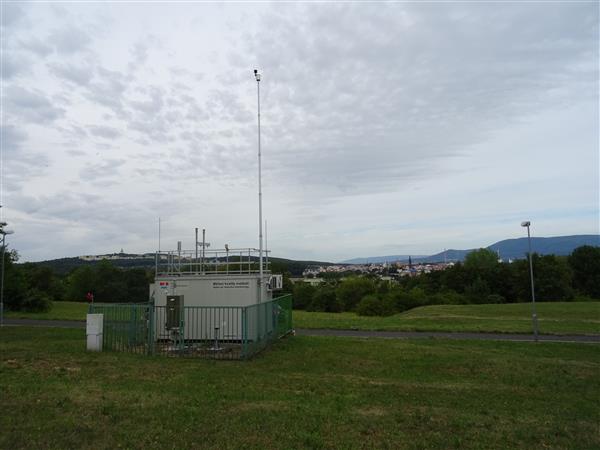
Map of station position
Map is on page with detailed information about locality